|
Mastering Dashboard Reporting (Data Visual) in MS-Excel |
|
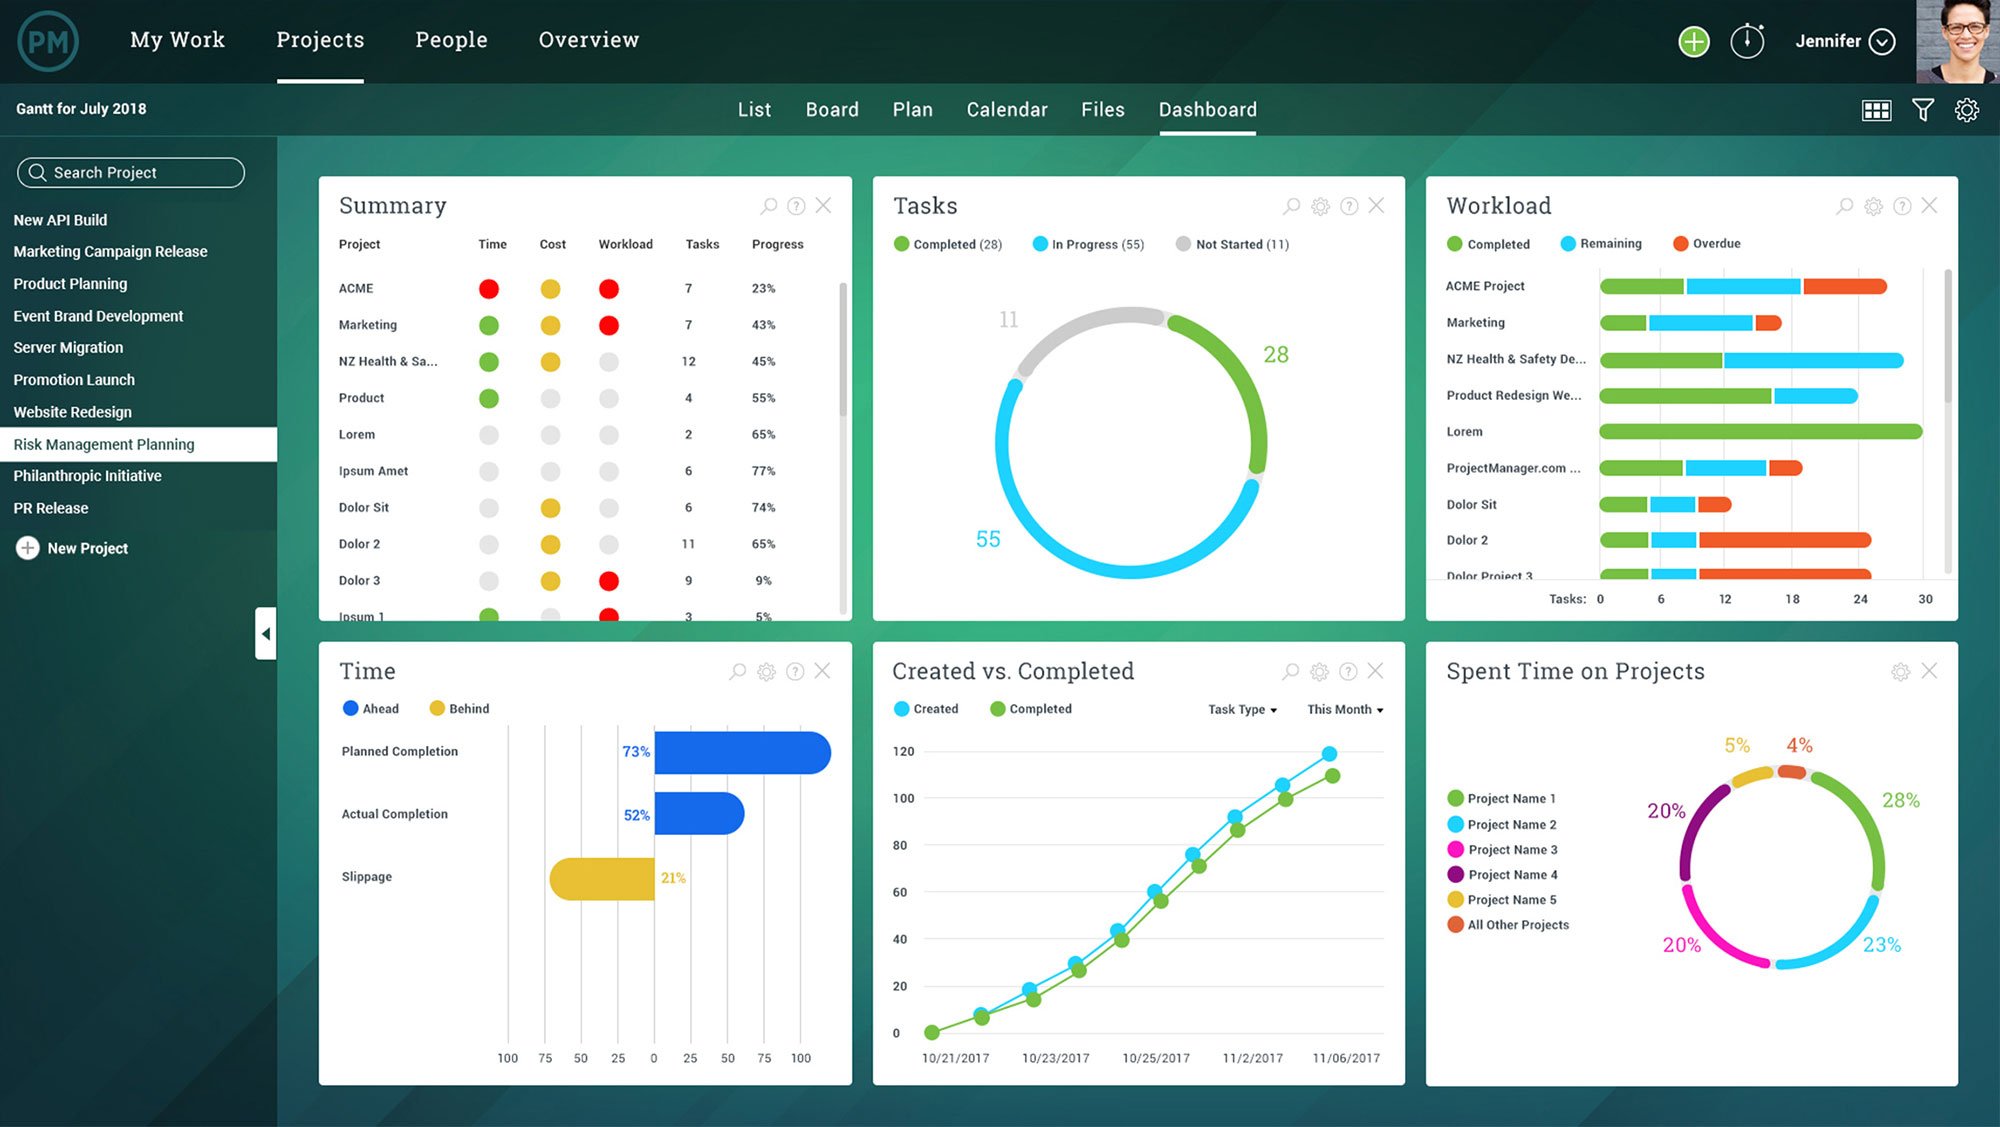
3rd-4th March, 2025 14th– 15th May, 2025 6th-7th August, 2025 6th-7th November, 2025 Introduction An Excel Dashboard provides insight, analysis and alerts. They’re fully interactive and dynamic and can help with project management, customer service, sales or retail management, financial forecasting and much more. Dashboard is a powerful tool for reporting. It helps in converting data into powerful and A business intelligence dashboard is a data visualization tool that displays the current
Dashboard has three main attributes: (i) Dashboards are typically graphical in nature, providing visualizations that help focus (ii) Dashboards often display only data that are relevant to the goal of the dashboard. (iii) Because dashboards are designed with a specific purpose or goal, they inherently
Course Outline Foundations of Data Visualization and Dashboard Design Introduction to Dashboard Reporting · Purpose and Components of a Dashboard · Differences Between Reports and Dashboards · Dashboard Design Best Practices Preparing Data for Analysis · Data Structuring, Cleaning, and Normalization · Removing Duplicates and Handling Errors · Naming Ranges and Using Excel Tables Core Excel Tools for Dashboards · Advanced Formulas (LOOKUPs, IF, INDEX/MATCH, etc.) · PivotTables and Pivot Charts for Dynamic Analysis · Using Named Ranges and Dynamic Data Sources Visualizing Data Effectively · Choosing the Right Chart Type · Creating Dynamic Charts with Named Ranges · Conditional Formatting for Highlighting KPIs
Building Interactive and Automated Dashboards Interactivity and Navigation · Adding Drop-Down Lists and Data Validation · Using Slicers and Timelines for Filtering · Creating Interactive Charts and Tables Dashboard Assembly · Designing the Layout and User Experience (UX) · Layering Multiple Components (Charts, Tables, KPIs) · Linking Multiple Sheets and Ranges Dynamically Automation and Final Touches · Automating Updates with Excel Tables and Queries · Protecting Sheets and Controlling User Access · Tips for Speed Optimization and Performance · Gant chart, flow chart, combo chart and more · Hands-On: Build a Full Dashboard from Raw Data · Review of Key Techniques · Group Presentation and Peer Feedback · Q&A and Certificate Presentation |
Duration: Two (2) days Fee: N180,000
Phone No:
08052062320, 08095284269, 07085271570
Email Address
training@nazellinkconsult.com info@nazellinkconsult.com
Contact Info
Address
2nd Floor, Acme House, 23, Acme Road, Ogba, Ikeja,Lagos. Nigeria.
Phone No:
08052062320, 08095284269,
07085271570
Email Address
info@nazellinkconsult.com