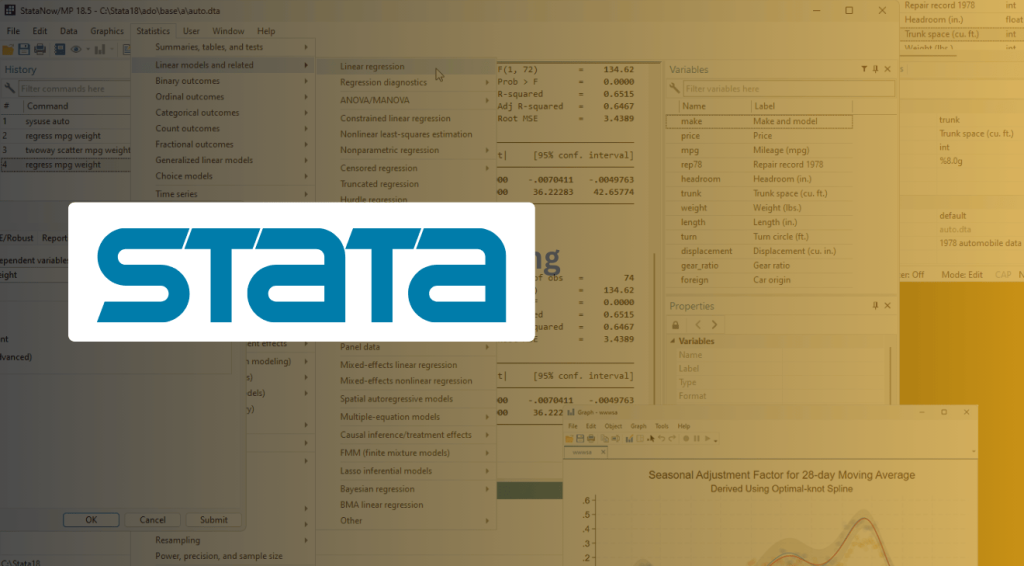
STATA APPLICATION TO STATISTICAL DATA ANALYSIS WORKSHOP
9th-11th March, 2026 10th-12th June, 2026
3rd-5th August, 2026 7th-9th October, 2026
INTRODUCTION
Stata is a general-purpose statistical software package used for data management, manipulation, visualization, and analysis.It is popular in fields like economics, epidemiology, and sociology and can be used through either a point-and-click interface or a command-driven language.
A typical Stata course progresses from fundamental concepts to more advanced techniques, covering data management, statistical analysis, and programming. The course content is usually divided into beginner, intermediate, and advanced levels to suit different skill sets.
Course Outline
Basic: Stata Interface and its Capabilities
Introduction to Stata Introductory courses focus on the core skills necessary to get started with Stata.
- The Stata interface:
Understanding the different windows (Command, Results, Variables) and the
menu system. - Data fundamentals:
Learning Stata’s file formats (.dta), importing and exporting data (e.g., from Excel or CSV), and basic file operations. - Basic data management:
- Creating, renaming, and labeling variables.
- Using the browse and list commands to inspect data.
- Handling missing values.
- Exploratory analysis:
- Generating descriptive statistics, such as means, medians, and standard deviations.
- Creating frequency tables and cross-tabulations.
- Basic data visualization: Producing simple graphs like histograms, box plots, and scatter plots.
- Reproducible workflows: Writing and using do-files to document and automate your work.
Intermediate: Advanced Data Manipulation and Statistics
Intermediate courses build on the fundamentals to cover more complex data handling and a wider range of statistical methods.
- Advanced data management:
- Merging and appending datasets.
- Reshaping data from “wide” to “long” format and vice versa.
- Using the by, collapse, and egen commands for group-wise operations.
- Inferential statistics and hypothesis testing:
- t-tests (one-sample, paired, independent).
- Chi-squared tests of association.
- One-way analysis of variance (ANOVA).
- Regression modeling:
- Simple and multiple linear regression (OLS).
- Regression diagnostics.
- Interpreting coefficients.
- Basic programming:
Introduction to macros and loops for automating repetitive tasks.
Advanced: Specialized Analysis and Programming
Advanced courses are designed for researchers and analysts who need to perform specialized or high-level analysis.
- Advanced regression methods:
- Logistic and other generalized linear models.
- Instrumental variables (IV) regression.
- Addressing issues like heteroskedasticity and endogeneity.
- Panel and time-series analysis:
- Handling longitudinal and time-series data.
- Running fixed-effects and random-effects models.
- Basic time-series modeling, such as ARIMA.
- Advanced programming:
- Writing your own Stata commands (ado-files).
- Using Mata, Stata’s matrix programming language.
- Automated reporting:
Using commands like putdocx to automatically generate reports and export
tables and graphs to other software. - Specialized topics:
Courses may also cover specific areas like survival analysis, multilevel
modeling, or survey data analysis depending on the discipline.
Thank you
Duration: Three (3) days Fee: N300,000
Phone No:
08052062320, 08095284269, 07085271570
Email Address
training@nazellinkconsult.com info@nazellinkconsult.com
